The Black Scholes option pricing model assumes stock prices are lognormally distributed. While the assumption is reasonable, it tends to underestimate the probability of extremely large stock price movements, which have been empirically observed. As a result, option traders assign unique volatilities to options of different strikes, generating a so-called volatility surface across strike and time. An implied distribution is also created, providing meaningful insight into the market's expectations for future stock price outcomes. The shape of the distribution can be inferred from the relationship among option prices of a specific expiration for a particular stock. Looking at option prices and their potential payouts, we back out an implied distribution for stock price returns. In an options market that has become increasingly used to monetizing specific views on stock price outcomes, an intuitive understanding of how implied distributions can be calculated and how trading opportunities may emerge from them is a useful exercise.
Graphing Call, Put Flies

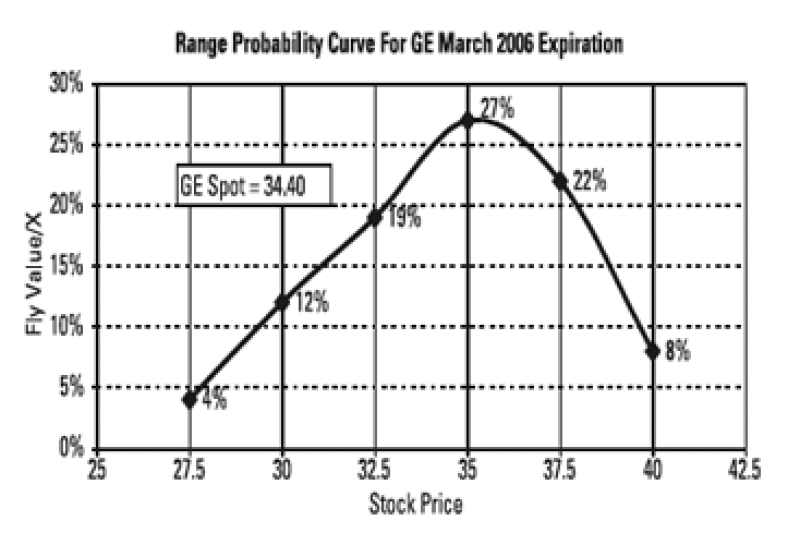
Without using a complex options pricing model, one can use intuition to translate option prices into implied probabilities. For instance, the value of the call and put butterfly can be thought of as being directly proportional to the likelihood of the stock finishing around the middle strike where the maximum payout occurs. Furthermore, the call fly has the structure of long one call with strike (K-X), short two calls with strike (K) and long one call with strike price (K+X). Thinking of this structure as long a (K-X,K) call spread and short a (K, K+X) call spread illustrates the capped payout of the structure. The long and short call spreads both yield a maximum payout when the stock finishes exactly at the strike price, K. Assuming an expectancy-based calculation is used to derive the price, we can back out the probability of the stock finishing around K from the maximum payout and the premium paid. For example, if the General Electric March 2006 expiration 30/32.5/35 put fly is mid-market at USD0.475, an estimate of GE finishing around USD32.5 at March 2006 expiration would be USD0.475/USD2.50 or a 19% probability. Repeating this calculation for all of the listed flies for March 2006 expiration allows us to generate a range probability curve for GE at March 2006 expiration:
Call Spreads, Put Spreads
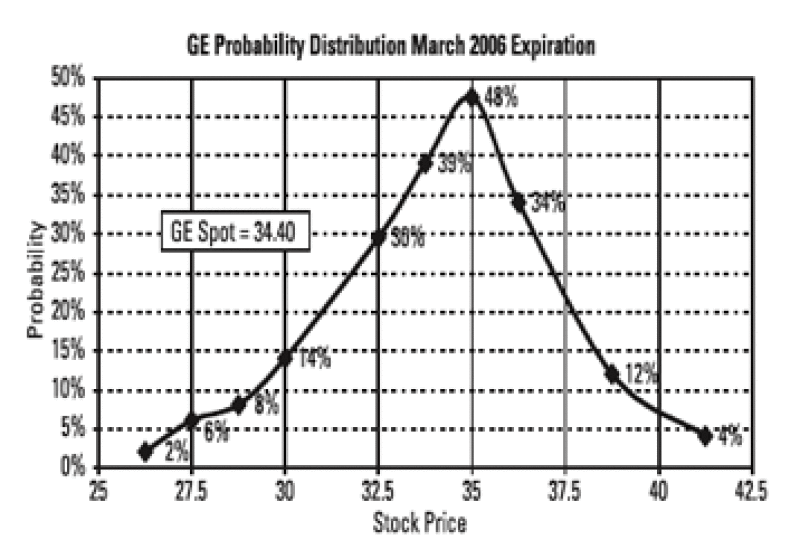
Above, we estimate a range probability curve for GE. Here, we will use call spreads and put spreads to estimate the probability of the stock finishing above or below certain prices. Again, we will assume that the value of a spread is proportional to the total expected value of the structure. Consider the GE March 35/37.5 call spread at USD0.85. The maximum payout is USD2.50 with smaller payouts occurring for stock price outcomes above USD35 and below USD37.5. Since the total expectancy for the trade is the probability of all the positive outcomes multiplied by their corresponding payouts, a lower bound for the probability that the stock finishes above USD35 is the premium paid divided by the maximum payout. Thus, a conservative estimate for the probability that the stock finishes at USD35 or higher implied by the USD0.85 price for the call spread is USD0.85/USD2.50 or 34%. To account for the fact that the expectancy for the trade is not equally distributed along the potential payouts, we use a linear approximation and determine that 34% represents more closely the probability of stock finishing above the midway point of the two strikes, or USD36.25. Further, consider the March 30/27.5 put spread with mid-market price of USD0.20. Using the above methodology, we estimate that the market implies an 8% chance for GE to finish at USD28.75 or lower by March 2006 expiration. Graphing all of the out-of-the money call spreads and put spreads listed for March 2006 expiration allows us to sketch a probability distribution for GE for the March 2006 expiration.
Conclusion

This quick and intuitive estimation technique for determining the risk neutral probabilities implied by option prices allows an investor to properly assess the market's expectation for possible stock price returns in the future. The probabilities estimated in this exercise should be considered risk neutral probabilities, and the values used in the above illustrations are mid-market values. When implementing a trade, one should consider the premium paid/received when making an investment decision. By overlaying one's fundamental view against the market's expectations, areas of potential opportunity may be readily identified. This analysis has numerous applications as the implied distribution should be relevant to fundamental modeling assumptions, the probability of a credit default, comparison to embedded optionality in a convertible security, and the fair value assumption for a security price. Specifically, overwriting funds may compare potential floors and caps for stock price moves to the market's expectations to identify an optimal strike to short. In addition, equity investors not currently utilizing derivatives will find this analysis a useful gauge for market sentiment for a particular stock and a good check against fundamental assumptions. Credit investors can readily compare probabilities associated with specific potential stock price moves with the assumed recovery rate and likelihood of a default for a security.
This week's Learning Curve was written by Pat Neal, v.p. and equity derivative strategist at Banc of America Securitiesin New York.


