In this Learning Curve we introduce a new framework for calculating and reporting correlations embedded in tranche prices: Base Correlations. These are the correlations required to match quoted spreads for a sequence of first loss tranches of a standardised CDO structure, for example DJ Tranched TRAC-X. In our view, a mechanism using Base Correlations produces a meaningful and well-defined correlation skew and avoids the difficulties associated with quoting correlation tranche-by-tranche, which can lead to meaningless implied correlations for mezzanine tranches. We also introduce the 'Large Pool Model' as a simple model to standardise how Base Correlations are calculated in practice.
Most structured credit pricing models use asset returns (equity returns as a proxy) and a Merton-based framework to determine when a company has defaulted. Because these returns aren't exactly normally distributed the joint distribution for a group of companies in a credit portfolio isn't normal either, leading to different implied correlations across different tranches for the same portfolio. A useful analogy is in the equity options market, in which traders adjust for the Black Scholes model's theoretical assumption that equity returns are exactly lognormally distributed, implying different volatilities across different strikes for the same underlying stock or index. It's possible that alternative models might better address credit non-normality, but we argue that market forces will still skew implied correlations. For example, strong demand to sell protection through super senior tranches may lead to tighter spreads and lower implied correlations for that part of the capital structure, while affecting spreads and implied correlations for other tranches, creating a skew.
So, the question becomes how do we best address implied correlation in standardised CDO tranches, and the remainder of this Learning Curve concentrates on the advantages of our approach: simplicity, replicability, a unique solution, realistic skews, and the ability to price off-the-run tranches.
A Simplistic Approach: Compound Correlation
Some market participants are already publishing implied correlations but we believe that there are significant weaknesses in the approaches currently used. What has generally been done is to agree on a model (usually a Gaussian Copula), which takes all single name spreads and a single asset correlation as input and produces the tranche spread as an output. A simple iteration process can then take the traded spread and produce an implied correlation. We define compound implied correlation as the single correlation that matches the value of a complete tranche of a synthetic corporate CDO to a market spread.
A New Approach: Base Correlation
Base Correlations are defined as the correlation inputs required for a series of first loss tranches that give the tranche values consistent with quoted spreads, using a standardised model. Equivalently, we can quote these same Base Correlations for the upper attachment point of these tranches. In order to obtain the Base Correlations for each first loss tranche we need to use a bootstrapping process. For example, consider tranche attachment points K1, K2, K3 ..., (3%, 6%, 9% ... for DJ Tranched TRAC-X Europe). The process for calculating the expected loss (EL) for each first loss tranche is as follows:
EL[0,Ki] = EL[0,Ki-1] + EL[Ki-1,Ki] for i >=2,
where EL[Ki-1,Ki] comes from the market spread on the [Ki-1,Ki] tranche and EL[0,K1] is the expected loss from the first observable first loss tranche. Once we have expected losses for the sequence of first loss tranches, we can solve for the single Base Correlation for each tranche.
Using The Large Pool Model
The model we use to imply correlations in tranches is known as the Homogeneous Large Pool Gaussian Copula (the "Large Pool Model", or "HLPGC"); a specific version of the Gaussian Copula widely used in the market. This model is not new: the methodology is almost identical to the original CreditMetrics model (Gupton et al, 1997) and is a simplified form of earlier one-factor models (Vasicek, 1987). It is described in numerous places, for example Schonbucher (Credit Derivatives Pricing Models, 2003). Using the Large Pool Model has advantages over using a more sophisticated Gaussian Copula because of a need for simplicity and transparency, in our view. Even though these "standardised" Copula models are in principle open and transparent, each has its own implementation, and requires multiple inputs that are difficult to agree on instantaneously--such as the spread and recovery rate of each of the 100 names in the DJ TRAC-X portfolio. It is therefore very difficult for an investor to take these quoted "implied correlations" and calculate the appropriate tranche spreads. To enhance transparency, we intend to make our implementation of this model freely available.
Why Is Base Correlation An Improvement?
We fully anticipate that there will still be some discussion on the relative merits of different methods of implying correlation from tranche prices--it's not clear that one method is "right". However, we present the key reasons we believe that Base Correlations offer many advantages over compound correlations:
1. Base Correlation is well defined
Tranches of credit portfolios can be thought of as options on portfolio losses; specifically, a call spread with strikes at each attachment point. In the same way that it would not make sense to quote an average implied volatility for an equity option call spread, we believe it is inappropriate to calculate a single implied correlation for a tranche. Instead, any framework for implied correlation should involve the concept of a skew defined by the strikes of the tranche.
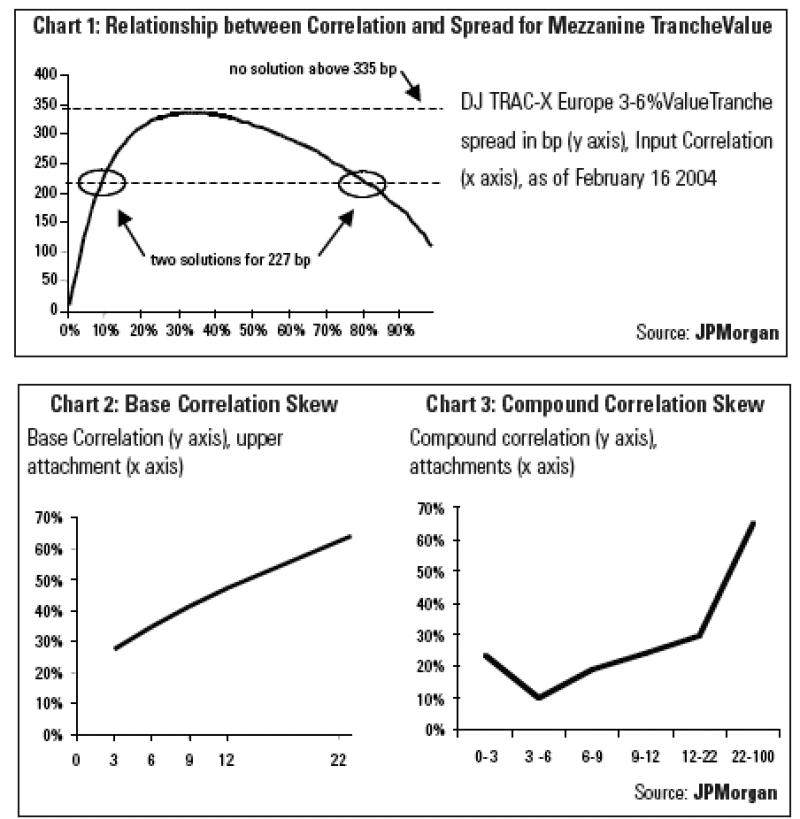
Without the concept of a strike-dependent skew, quoting a single implied correlation is especially problematic for mezzanine tranches. Chart 1 plots spread for the 3-6% tranche of DJ TRAC-X Europe for various correlations. It can be seen that for the traded spread of 227bp, there are two possible correlations, one around 10%, and another around 80% (and no solution above 335bp).

2. Base Correlation defines a more meaningful skew
We show the Base Correlation skew of DJ Tranched TRAC-X Europe 5-year on 19 February 2004 in Chart 2. In Chart 3, we plot the compound correlation derived from the same underlying data. It can readily be seen that the Base Correlation plots a much smoother line between the correlations of the first loss and senior tranches. We believe that the compound correlation skew shape is an artefact of the methodology.
3. Base Correlations can be used naturally to value off-the-run tranches
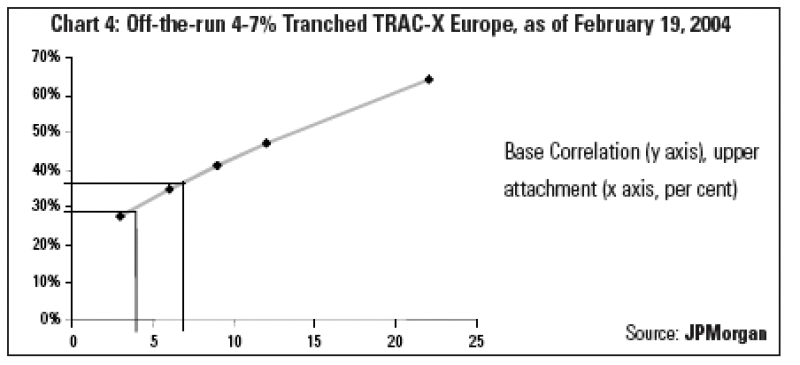
An important application of the Base Correlation framework is that it allows market participants to quickly and consistently determine value for tranches other than those that trade actively. Using a Base Correlation framework, we can use the market standard liquid tranches to calibrate the model for Base Correlation inputs, and then interpolate from these to value an off-the-run tranche with the same collateral pool--for instance a non-standard 4-7% tranche based on the DJ TRAC-X Europe index (Chart 4). Using Base Correlations, the parameters for the upper and lower strikes of 4% and 7% can be read directly off a skew chart by interpolating between known points. In contrast, it is problematic to use compound correlations for the 3-6% and 6-9% tranches to find a derived price for the 4-7% tranche since it involves non-transparent choices on how to form a 'weighted average' between the two.
Conclusion

Base Correlations calculated with the Large Pool Model provide market participants with a measure of implied correlation in tranches which has the advantage of simplicity, replicability, a unique solution, realistic skews, and the ability to price off-the-run tranches. We believe that these advantages over a compound implied correlation approach will make the tranched credit market more transparent and aid the development of correlation as an asset class.


